Last edit: 05-03-17 Graham Wideman
| Last edit: 05-03-17 Graham Wideman |
Data Acquisition |
| Studying LabVIEW Using QueryPerformanceCounter |
99-06-16 Article created
99-07-01 Extensive revisions based on correspondence with National Instruments
This Page
The LabVIEW functions that provide timing on the millisecond level are the "Wait" and "Wait For Next ms Multiple" vi's. Both are based on the same underlying mechanism; I focused on the "Wait For Next ms Multiple" function, used in a very standard timed loop configuration (diagram further below).
To measure when things are happening, I used the Windows API function QueryPerformanceCounter. This function on x86/Pentium platforms looks at a high-resolution system hardware counter that runs at approximately 1.2 MHz, or 0.8 microsec/count. The actual resolution, once you account for the delay in calling the function, will be considerably less, but still far better than 1 millisec.
To study the behavior of LabVIEW's "Wait For Next ms Multiple" function, I wrote a simple vi that uses the Windows API high-resolution QueryPerformanceCounter function. The diagram looks like:
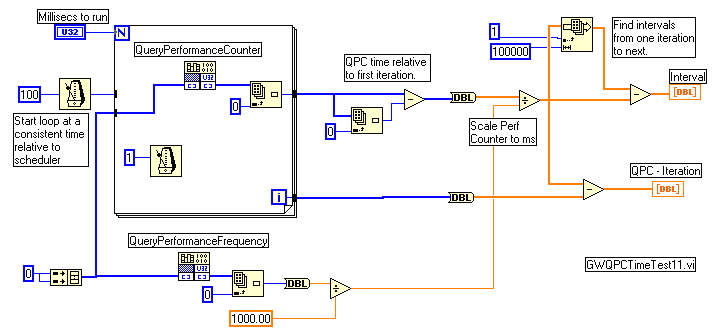
This vi is available for download here: GWQPCTimeTest11.vi
Note the bare minimum of activity inside the loop structure. The "Interval" and "QPC minus Iteration" graphs should give us a fair idea of the consistency of timing under various circumstances. A couple of program notes:
In general, an approach to the study might be to run tests that isolate each possible factor, and examine the impact that it has. However, one of the lessons that we learned was that there are a large number of factors, many of which the user/developer can't control, especially things like the housekeeping activities that the operating system performs at times of its own choosing. Running the same tests on apparently similar PCs provided considerably different results.
Consequently, we were obliged to settle for presenting a survey of example situations, which should not be taken as representative, along with presenting a LabVIEW vi that you can use and adapt to examine your own situations.
We have selected a variety of relatively mundane scenarios, and have run each test at Normal and at TimeCritical priority for comparison. Every scenario was run several times to get an idea of how much consistency there was. Again, none of these tests have high statistical validity, and there was considerable variation between machines.
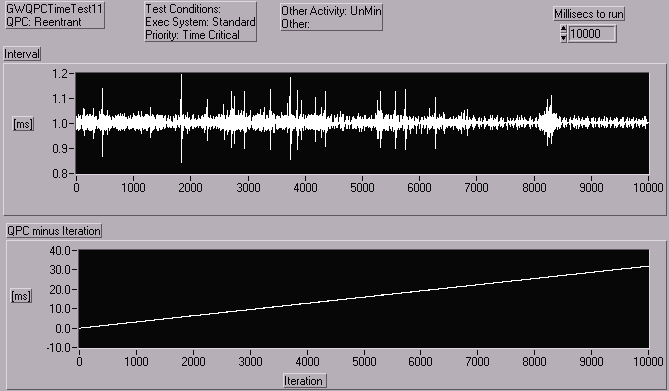
This run was conducted with little else obvious happening on the machine.
Normal priority and Standard execution system.
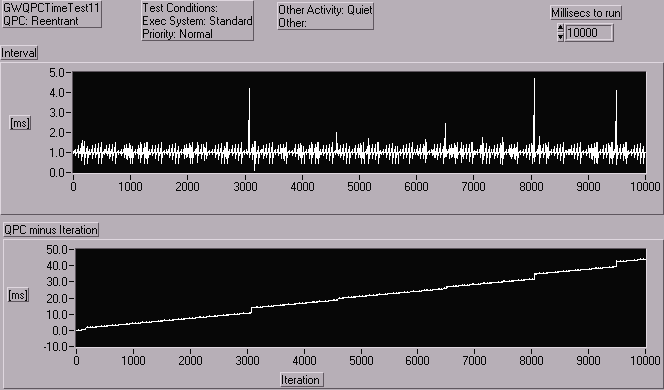
The upper plot shows the actual duration of each of 10000 loops. The lower plot shows actual time elapsed (in milliseconds) since the beginning of the run, subtract the loop count. Therefore this shows the amount by which the loops are "falling behind" the time. A step appears wherever a loop takes more than 1 ms. This is especially helpful to judge the overall impact of several successive spikes that are too close to distinguish on the upper plot. In this example, the lower plot shows that the 10000 loops were completed about 45 milliseconds later than expected.
Here are a few of the other features of interest:
 Mostly
1 ms Intervals: Intervals are fairly consistently very close to 1 ms, with
relatively infrequent small deviations, and even more infrequent larger deviations.
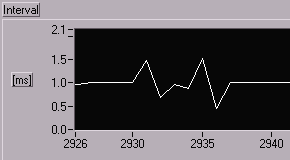
Minor Spikes are "caught up": Each minor spike on the Interval graph in the positive direction (of less than the Wait interval of 1 ms) indicates an iteration that was delayed slightly. This is followed by an iteration interval that is shorter, to get the loop "back on schedule". The expanded view at right shows an example of this at loop 2931, where an iteration is delayed, and then followed by an iteration with a shortened delay.
 Major
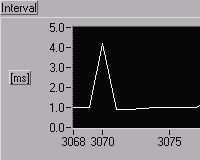
Spikes = Missed millisecs: The larger Interval spikes (> 1 ms) indicate
iterations delayed longer than 1 ms, and result in missed milliseconds. The graph to the
right shows an expanded view of loop 3070 where a 4 millisec loop time occurs. These is no
compensating series of short loops -- instead those milliseconds are simply skipped.
These cause corresponding steps in the (QPC - Iteration) graph, where the actual time
count "gets ahead" of the iteration count.
Is the non-recovery of this delay unexpected? Given these outside sources of delay, this is the "correct" behavior for the "Wait for Next ms Multiple" function. However, it may not be what the programmer expected: 1000 iterations of an empty "Wait for Next ms Multiple" loop will take longer than 1000 ms.
Drift: There is also a slow drift between the QPC and the iteration count, seen as a gradually rising slope in the (QPC - Iteration) graph. This appears to be due to LV's millisecond mechanism being slightly slow. Since that's based on the OS scheduler's quantum, this apparently means that the OS's quantum is a little larger than 1 ms. (Note that while LV is running, the OS quantum is set to "high resolution", as opposed to the usual 10 or 20 millisec quanta that are used normally.)
Quiet -- Time Critical
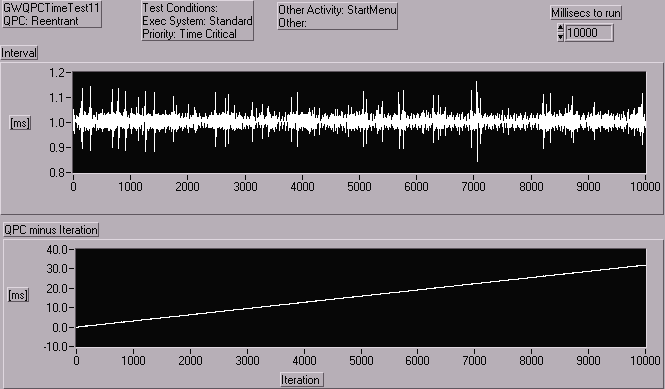
Same scenario as above, but VI (and hence thread) priority raised to the maximum, TimeCritical.
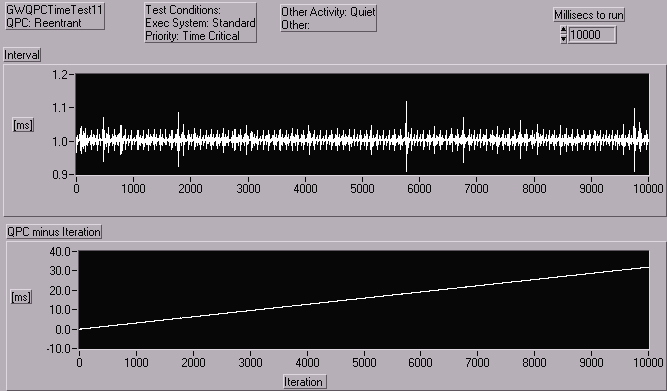
Significantly lower variations in loop duration, and no > 1ms spikes. We should note that in other runs, we did see > 1ms spikes, as the OS fired off some housekeeping disk activity.
Priority: Normal
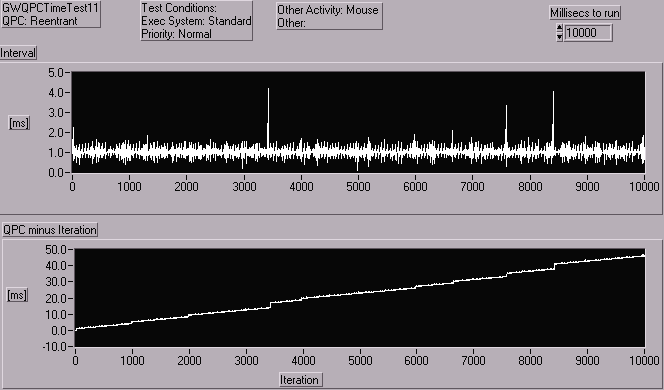
Priority: Time Critical
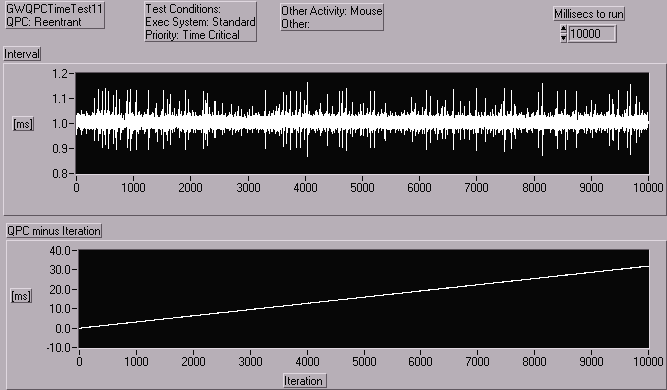
Raising the priority greatly reduced spikes during the mouse test.
Opening the Start Button -- Program Menu and some submenus invokes disk reads that show up as spikes.
Priority: Normal
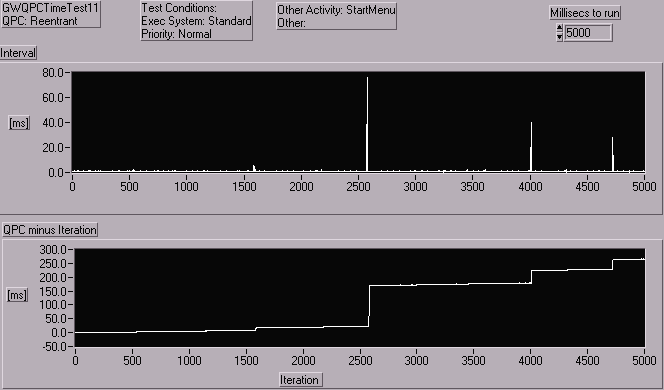
Note spikes up to 80 ms. In scenarios varying from this only slightly, we have seen spikes up to 250 millisecs.
Priority: Time Critical
Spikes eliminated. Presumably, the Start Button's disk activity is at a priority lower than Time Critical.
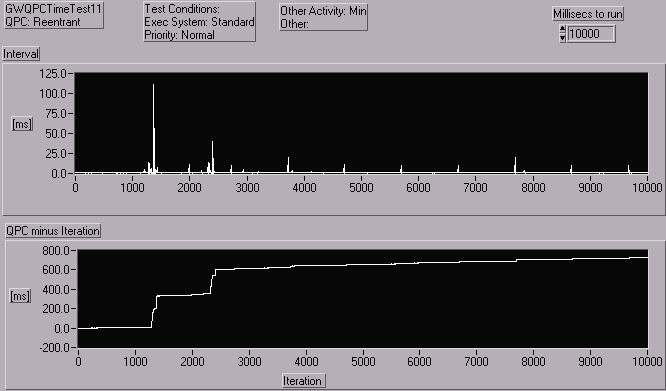
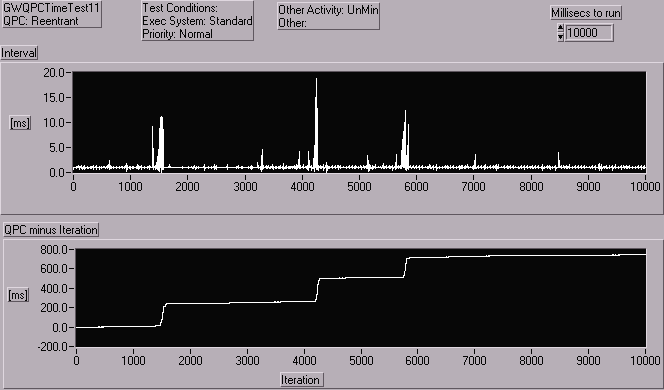
During this test, several windows were minimized by clicking on the minimize button on the window title bar (eg: at 1300, 2300 and 3800 on the Normal plot, and 3500, 4300, 4800 on the Time Critical).
Priority Normal
Priority: Time Critical
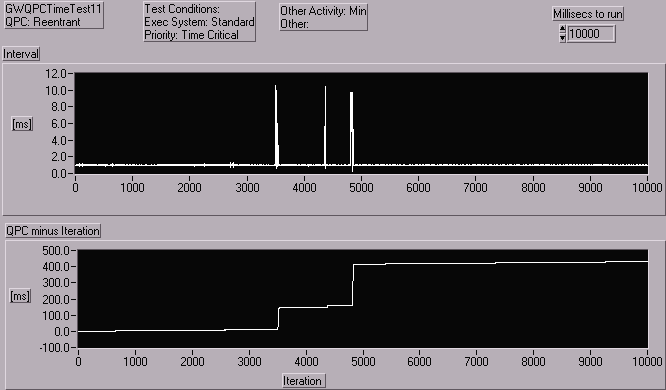
Note how the size of the spikes (ie: stretching of individual loops) is greatly reduced at Time Critical, but the number of loops disturbed greatly increased, as indicated by the steps in the lower plot. A detail view (below) of the spike near 4800 shows about 30 successive loops around 10 millisecs.

Priority: Normal
Priority: Time Critical
The impact of un-minimize appeared to be eliminated by the Time Critical priority.
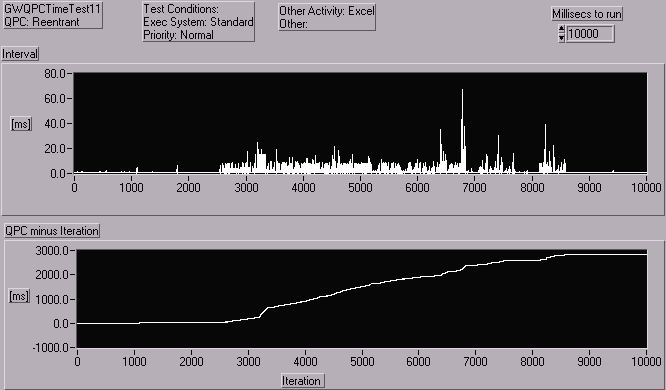
I'm not sure why this became a benchmark, but it seems to have been used with National Instruments' LabVIEW 5 priority demo. Anyhow, here's what it looks like. Note that you have to restart the system between runs, because, on Excel launches after the first, it is much faster since a number of components remained in memory.
Priority: Normal
Priority: Time Critical
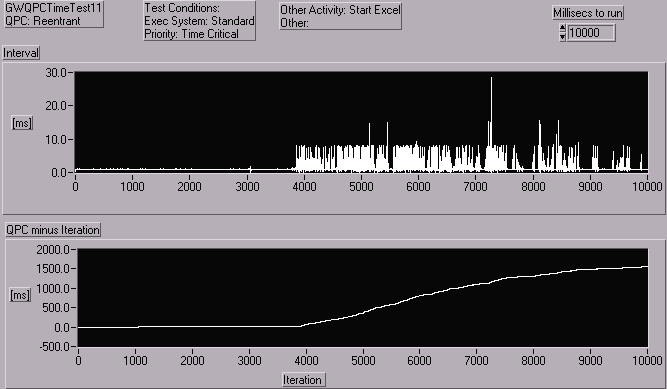
Time-Critical again greatly reduces the biggest spikes, and has some impact on the overall "time lost".
Clearly this is far from an exhaustive characterization of the behavior of LabVIEW's "Wait For" function (with its heavy dependency on the OS's scheduling services). However, I think that it does give some sense of the following issues:
1. When using the "Wait For" with the expectation that time request will be honored to a precision of tens or even hundreds of milliseconds, these requirements will not be met some proportion of the time, and the delays can be significant.
2. Boosting the vi priority to "Time Critical" has some impact, but doesn't completely fix the problem.
3. The competing thread activity that precipitates these delays can be from the most mundane system or user activity, and is probably hard to eliminate ("don't use the Start menu" probably isn't enforceable!).
None of this suggests that LabVIEW does a poor job -- it merely reflects the OS environment. However, it does mean that programmers need to evaluate whether their applications (whether developed in LV or other environments) can tolerate such occasional delays. In some applications it will be possible to devise ways to compensate, in other cases it will be necessary to use independent hardware to perform the time-critical tasks (such as the more real-time capable LabVIEW-RT hardware).
Evaluating the your application's prospects would be far easier if there was a comprehensive characterization of the timing environment, but there isn't one, and it appears that this is an intrinsically tough problem, dependent as it is on so many factors, many of which are dependent on the particular system that the application is running on. Amongst the advice offered to me informally from National Instruments, applicable equally to LV or other development environments:
... the differences that we measured on recent versions of NT and using simple means for distracting or loading the OS indicate that [coming up with an authoritative characterization] is nearly impossible and if the user is trying to rely on the determinism of the system, they will [need] to build something similar and characterize it themselves.
What it boils down to [...] is that people who know what they are doing have used LV, DOS, MacOS, Windows, and other non-realtime tools to build deterministic systems in the past because they built it, characterized it, and tweaked it. Then they left it alone. Adding one more grain of rice means needing to recharacterize it. Windows NT is still at that stage. If people want statistics on their aggregate system, they must gather the data, stress the system, and make the call as to whether it flies [...]. LV-RT is NIs attempt to change that. With a RT OS, more people will get it right and it is less chaotic when changes are made.
The examples shown here were run on (and screen shots taken from) the following system:
I expected that LabVIEW's manuals, or perhaps third party books, would have something authoritative to say on the subject of timing variability, but could find very little. The two most prominent things that the LV5's docs say are:
Function and VI Reference: Wait Until Next ms Multiple: Waits until the value of the millisecond timer becomes a multiple of the specified millisecond multiple. Use this function to synchronize activities. You can call this function in a loop to control the loop execution rate. However, it is possible that the first loop period might be short.
Online Reference Topic "Timing": The timing functions express time in milliseconds (ms), however, your operating system might not maintain this level of timing accuracy. (Windows 95/NT) The timer has a resolution of 1 ms. However, this is hardware-dependent, so on slower systems, such as an 80386, you might have lower resolution timing.
Only LV's floating help tips for the Wait functions tell you "Timer Resolution is system dependent and may be less accurate than 1 millisecond. See Function Reference Manual for details." But the Function Reference Manual doesn't have those details.
Given that these otherwise comprehensive reference materials (and third party books) do caution regarding the first loop period (this is how the loop should operate if you think about it!), and about using a 386 (!), the lack of any mention of timing variability from the OS scheduler initially suggested to me that LV must somehow have remediated this conspicuous issue. As this study indicates, however, LV is impacted by OS scheduling just like any other application.
NI tells me that the lack of elaboration on this topic is regarded as a documentation error, and will be corrected at some point.
This article benefited greatly from correspondence, revisions and results from Greg McKaskle and Jim Balent at LabVIEW, other current and former NI staff, and also from other correspondents on the info-labview list server, notably Mark Hanning-Lee who sent me a vi with some revisions.
[Up to: LabVIEW Timing Topics]