Last edit: 05-03-17 Graham Wideman
| Last edit: 05-03-17 Graham Wideman |
Models |
| SDSU Student Information Management System (SIMS/CDPS) Article created: 98-07-15 |
From this page you see Entity-Relationship diagrams that pertain to the Student Information Management System that is used on several campuses in California State University (CSU) system, including San Diego State University.
Of all the systems on campus, SIMS (combined with CDPS) is the system most critical to university functioning, as it covers all of the following functions: Student Admissions, Records, Class registration, class/faculty/room scheduling, faculty-assignment tracking -- and a host of reporting functions and feeds to other systems that stem from these.
The system is developed and maintained partly by a central team (CASA) and partly on the user campuses to suit local needs. The system is a COBOL/CICS/VSAM application, and at SDSU totals about a million lines of code. A project is currently underway to replace the COBOL system with an Oracle-based version (SIMS-R), primarily to improve the flexibility of the functionality, but also to avert a year-2000 problem.
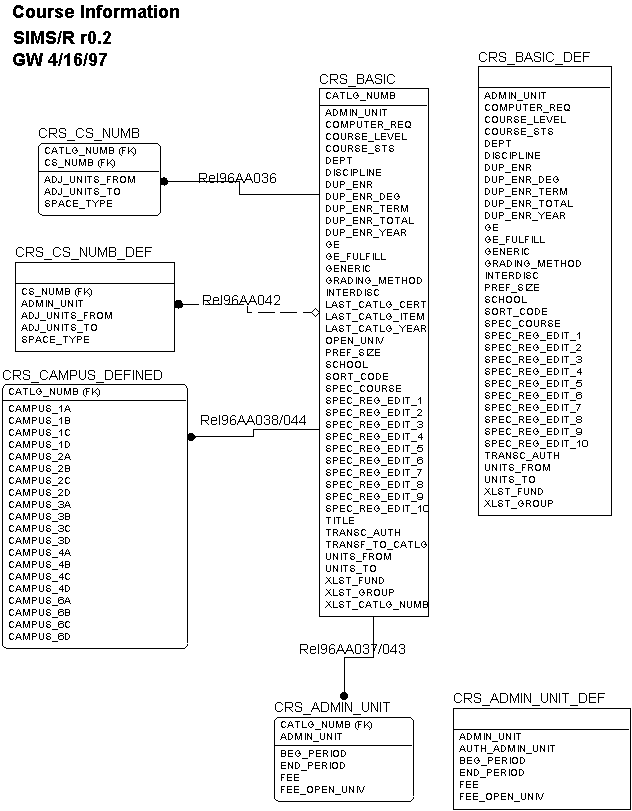
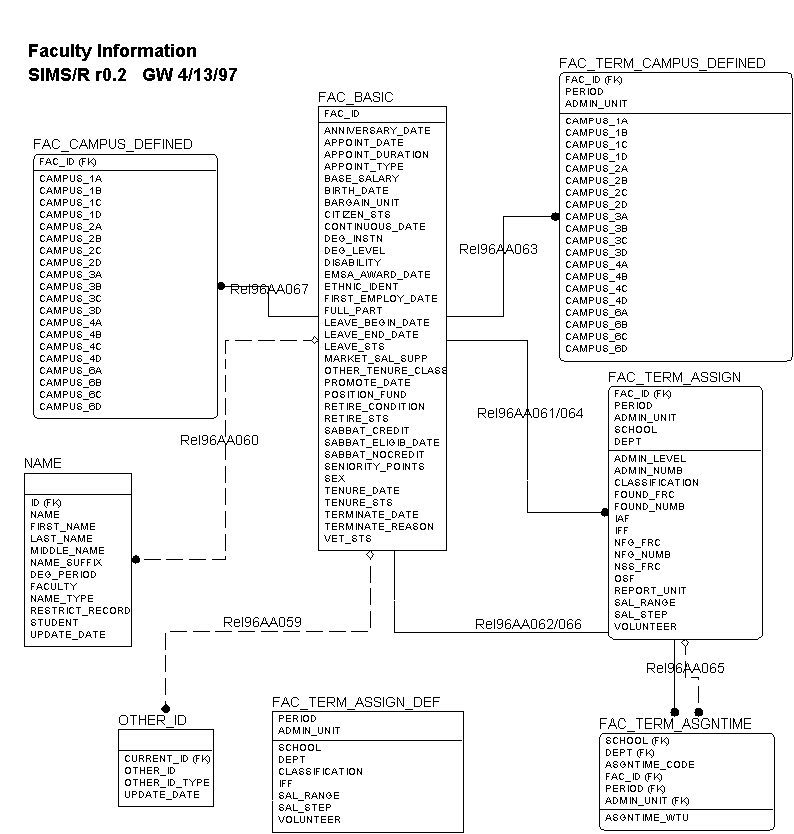
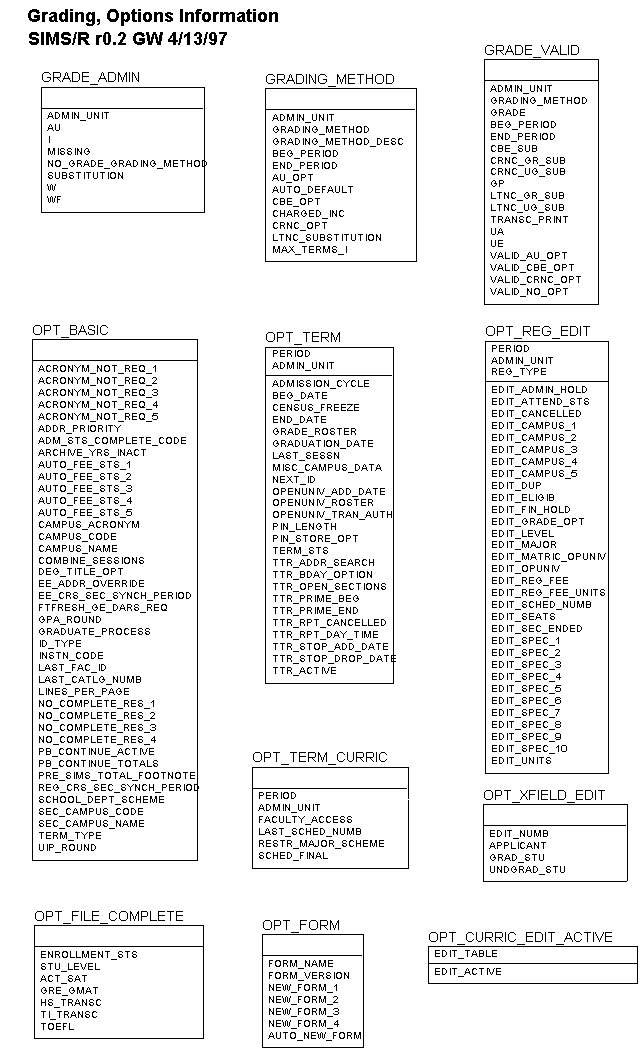
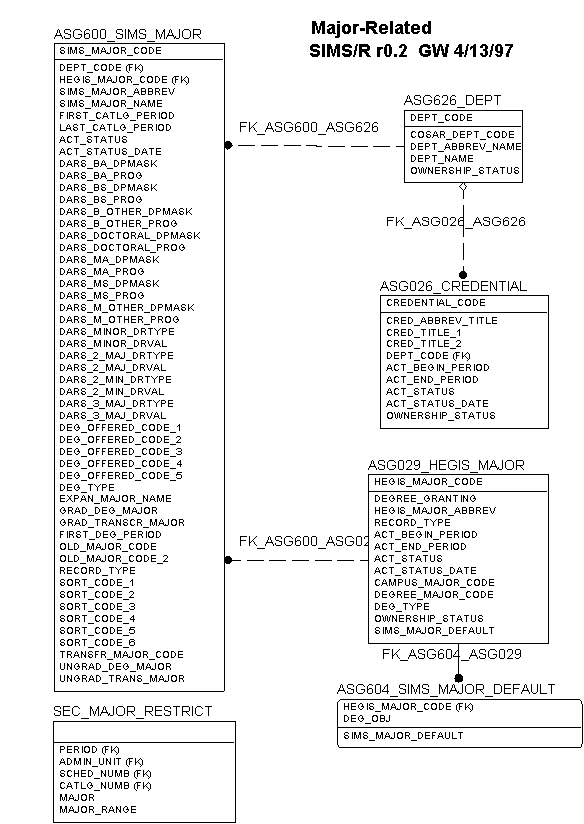
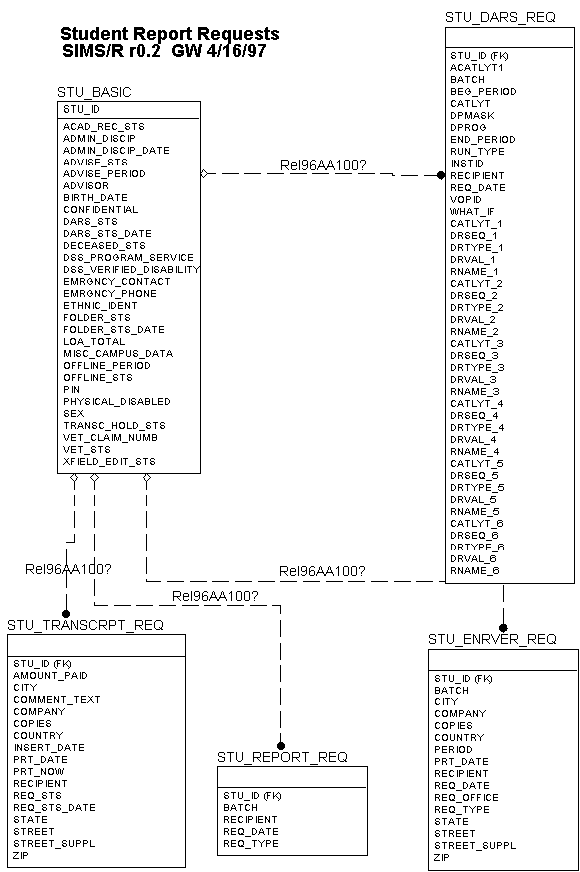
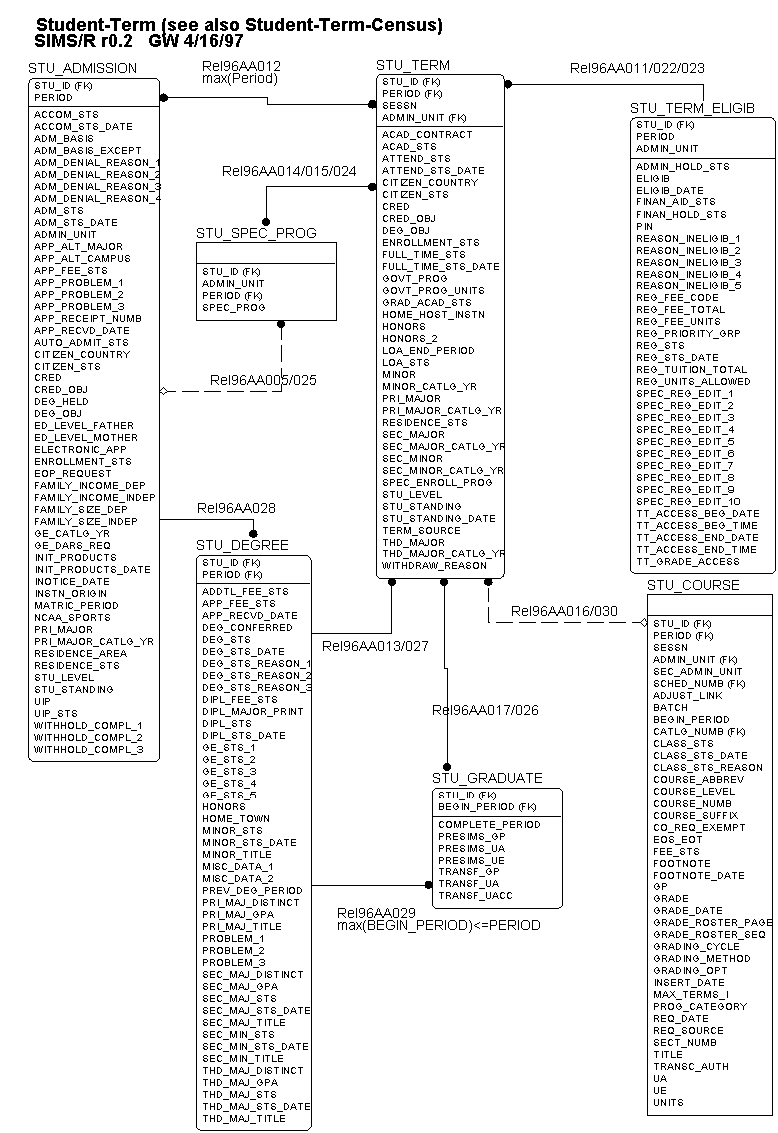
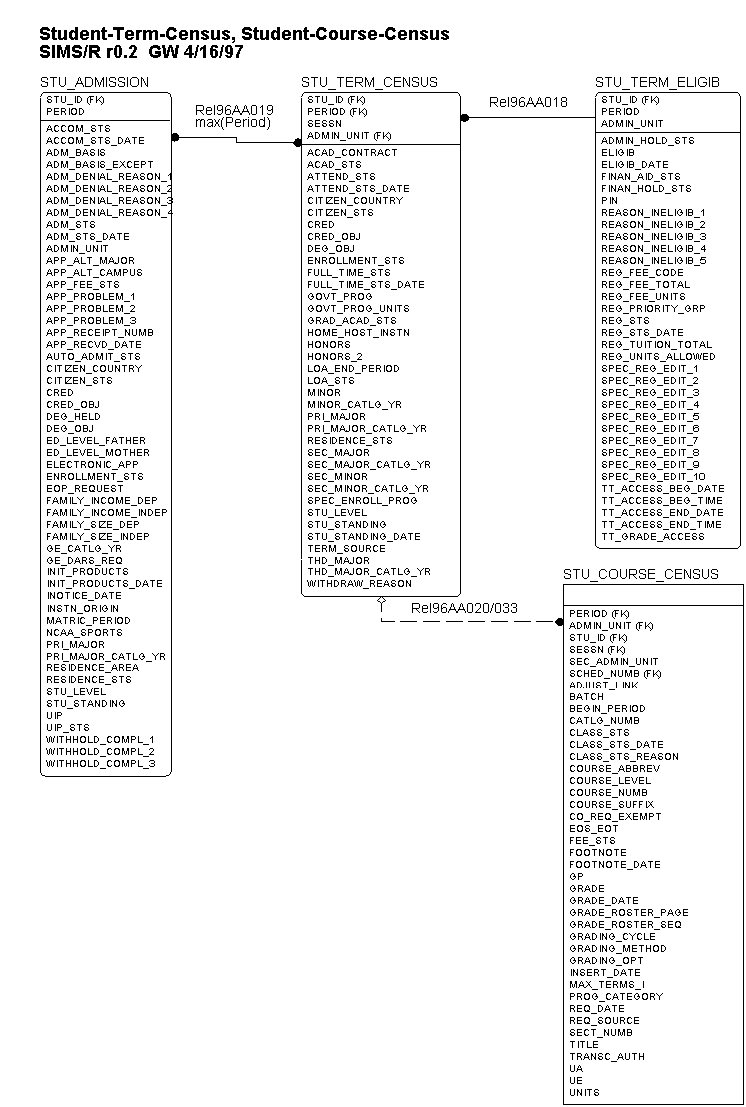
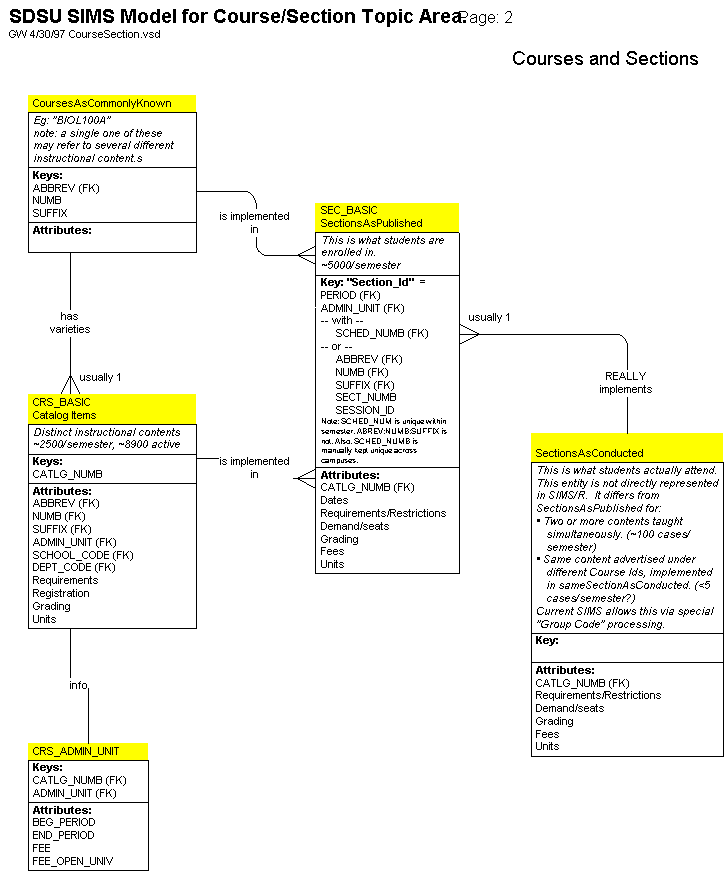
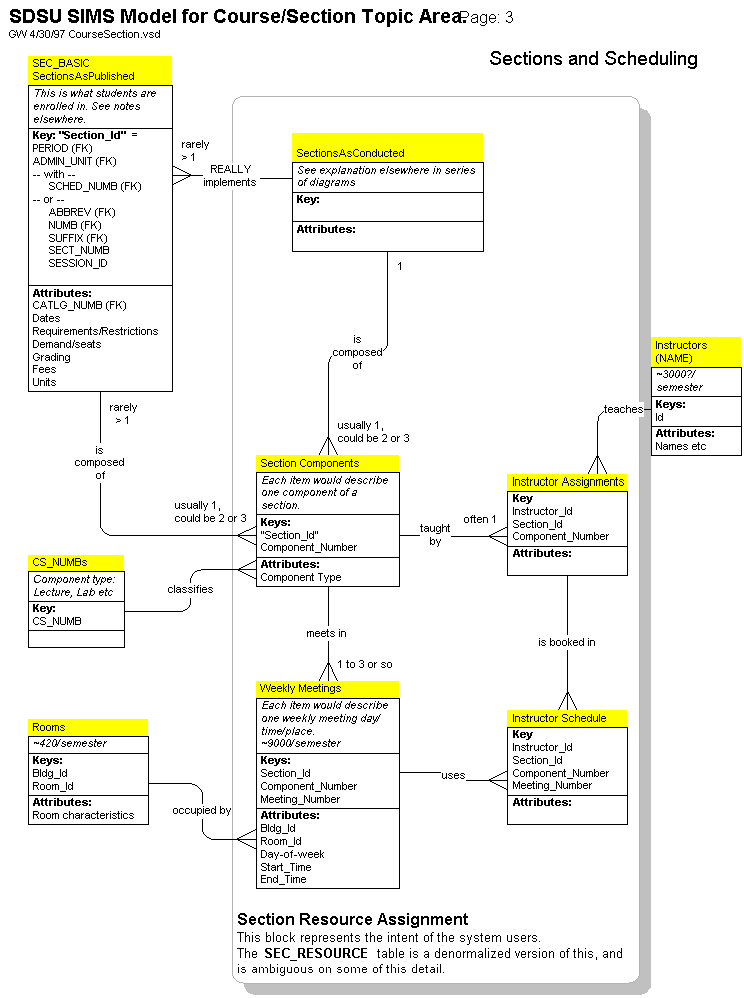
Because of SIMS' central role in campus operation, not surprisingly it contains a number of "dimensional entities" that are core to an overall campus information picture, and of course a great deal of important "content data". Hence it was essential to create at least a conceptual Entity-Relationship diagram as a preparation both for data warehousing, and also to build an understanding campuswide of how other operational systems might interact with SIMS and its successor.
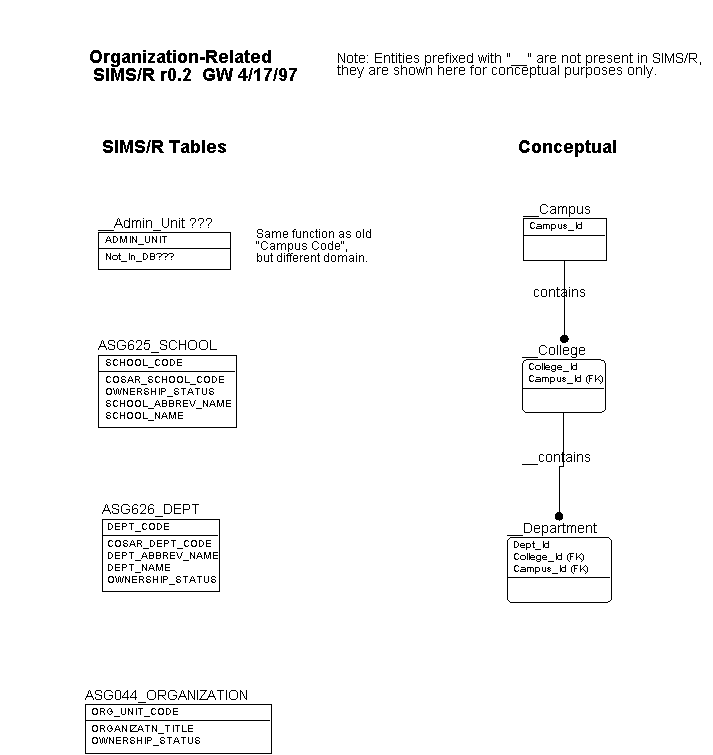
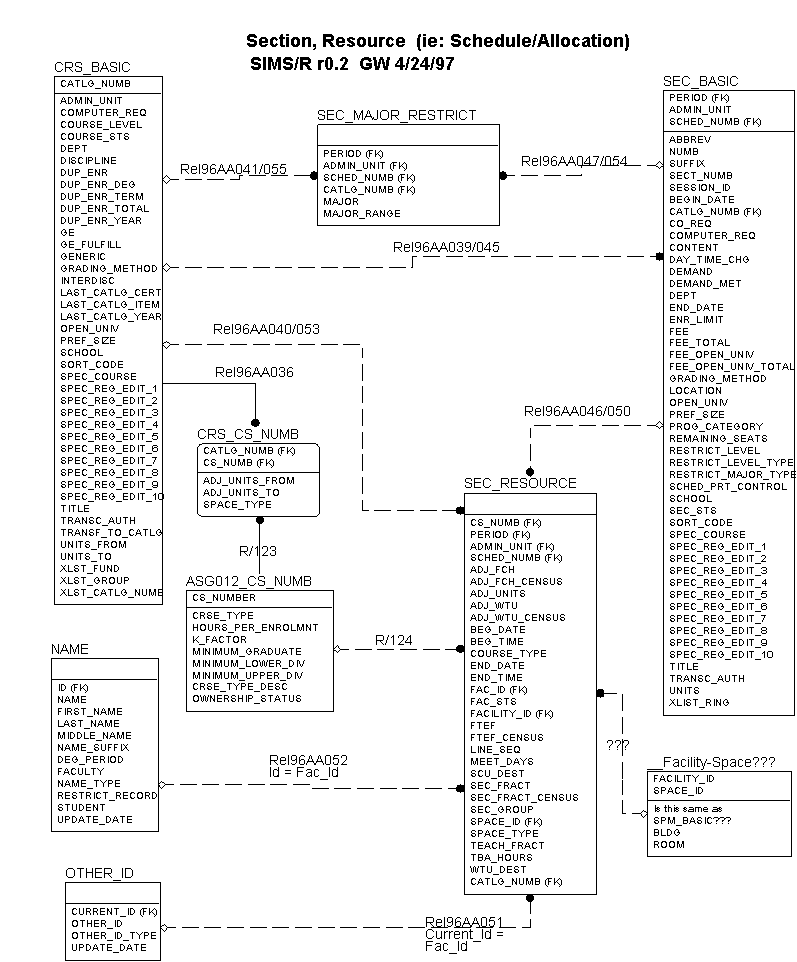
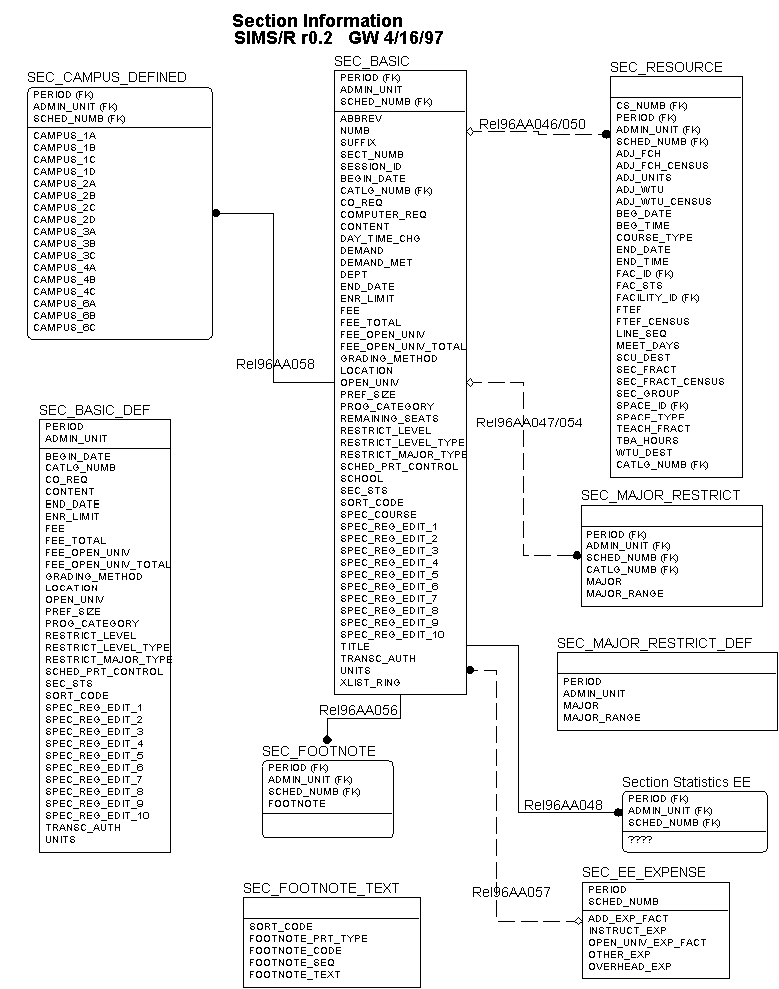
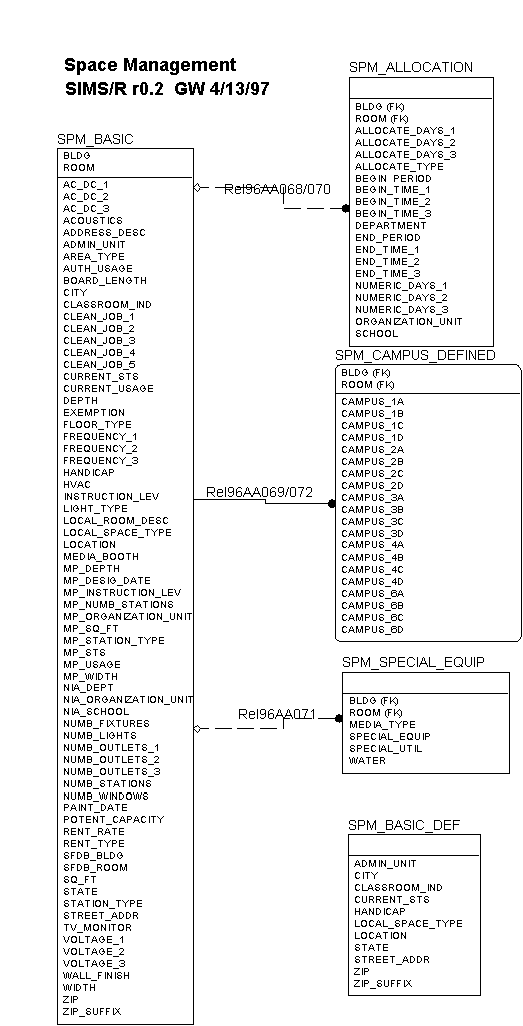
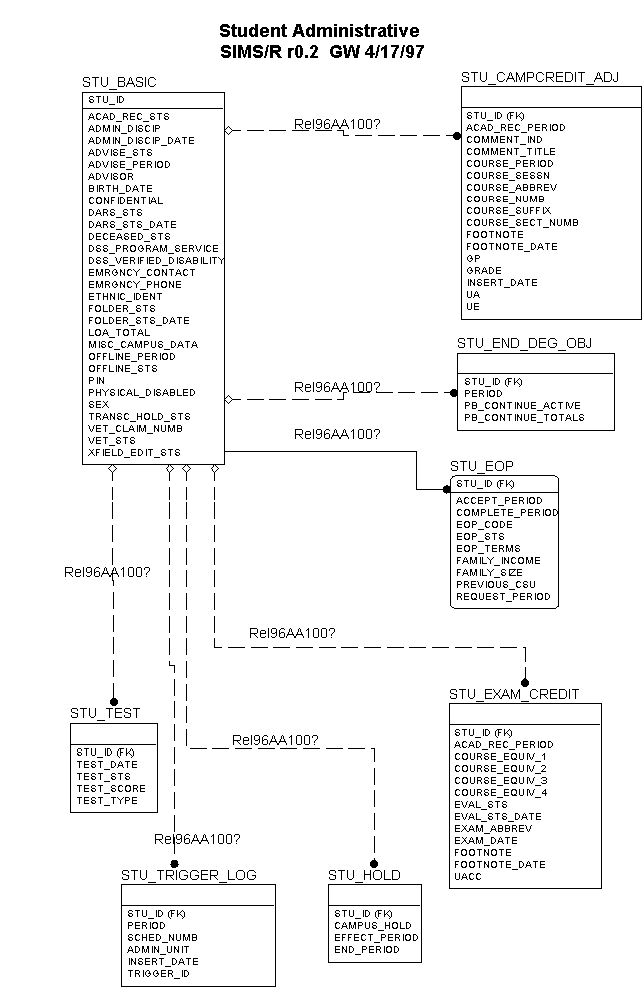
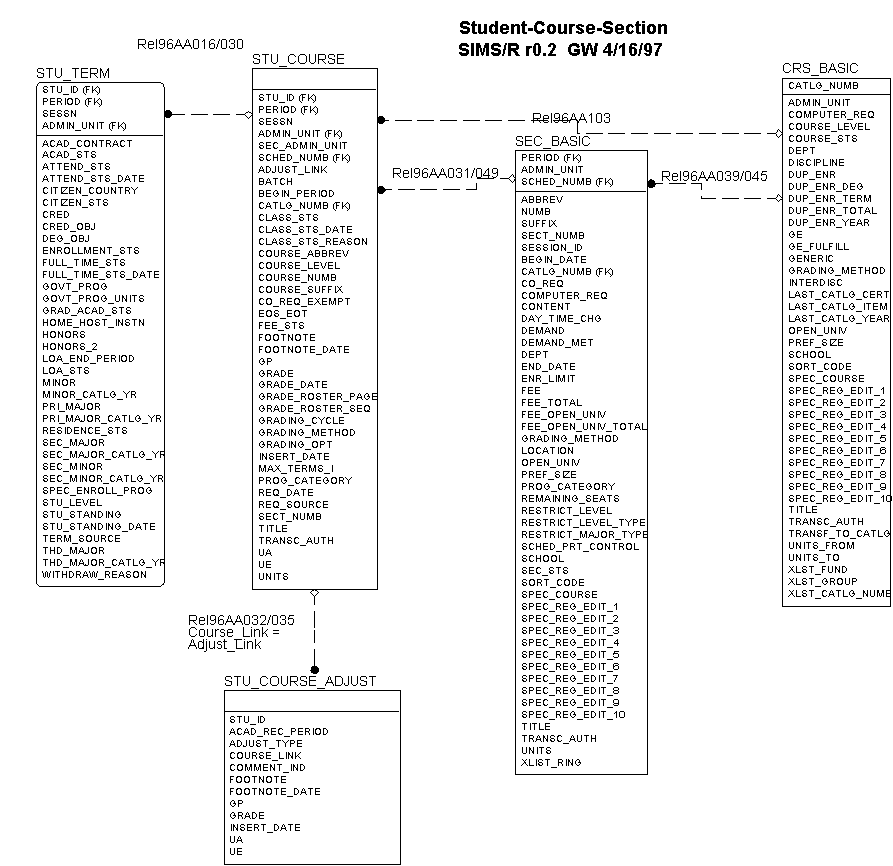
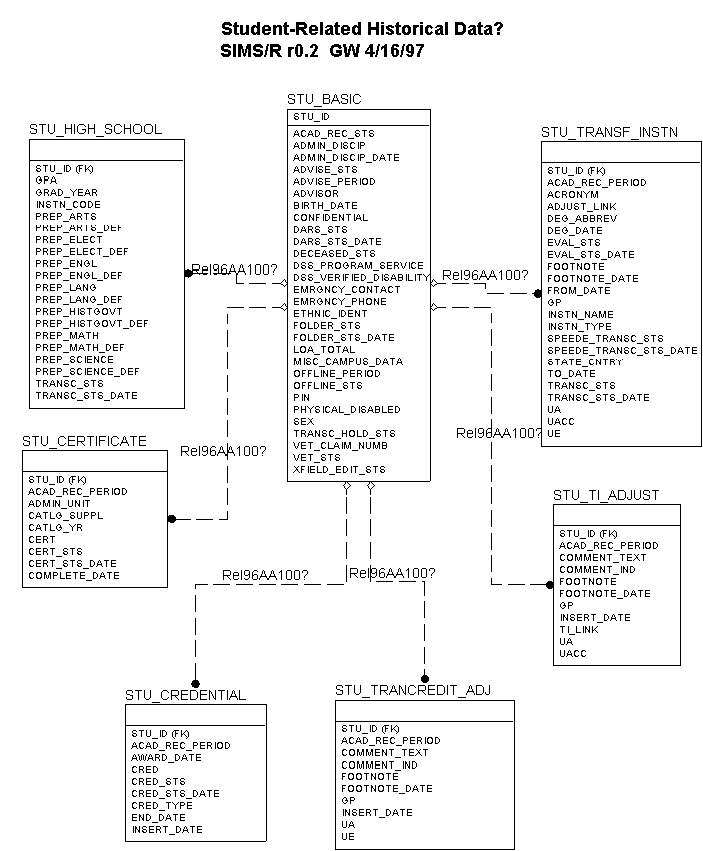
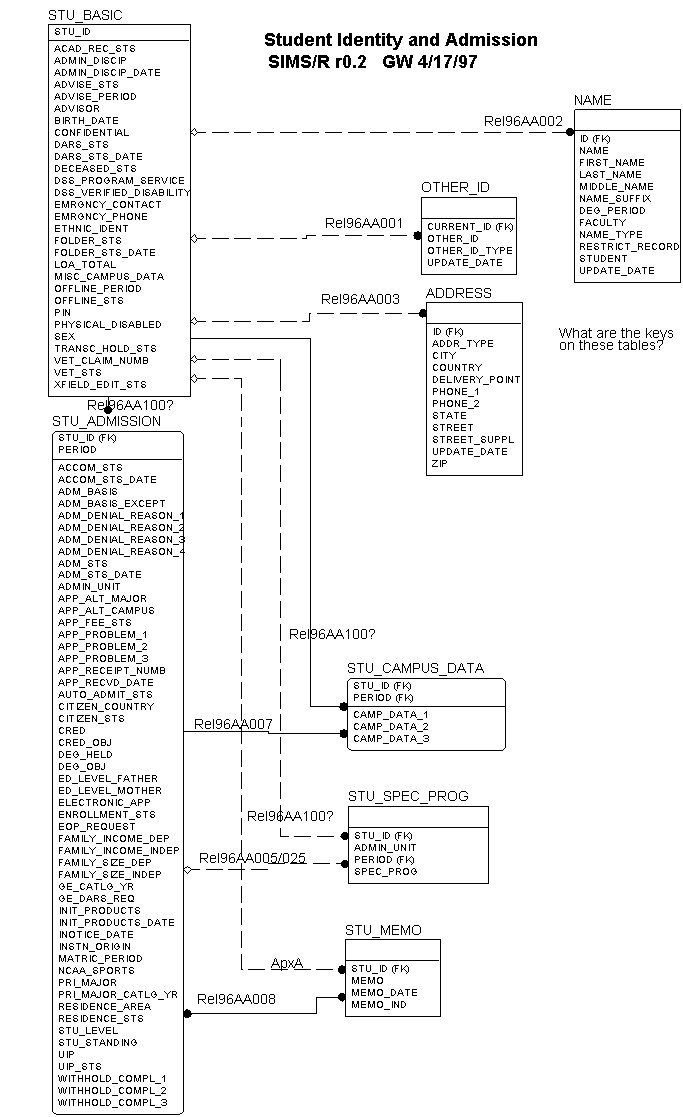
To carry out this analysis I reverse-engineered an early version of the SIMS-R tables into ERWin. It should be mentioned that the core-building CASA team are not using E-R diagrams, are using few primary keys, and are constraining almost no relationships in the database (this is, of course, a separate topic of "interest"). So the reversing step yielded only the tables, with most keys and relationships asserted by me based on other documentation. (The cryptic relationship names are cross-references to the other documentation -- it's important that all assertions in the model are traceable to some sort of reference.)
After the relationships were added, the next step was to create views that show groups of tables that are often used together, with an eye to producing drawings small enough to be printed on ordinary laser-printers or viewed on the web. This was to be a stop-gap measure to allow users across campus to have ad-hoc access to this critical model info.
Also, there are as many as two hundred additional code-lookup tables that are not shown in this model.
The following diagrams were developed by reverse-engineering SIMS/R r0.2 into ERWin. Note: ERWin uses a black dot for the "many" end of relationships. (Analysis 1996 and 1997). It may be convenient to use your browser's "Open in New Window" function to view these.
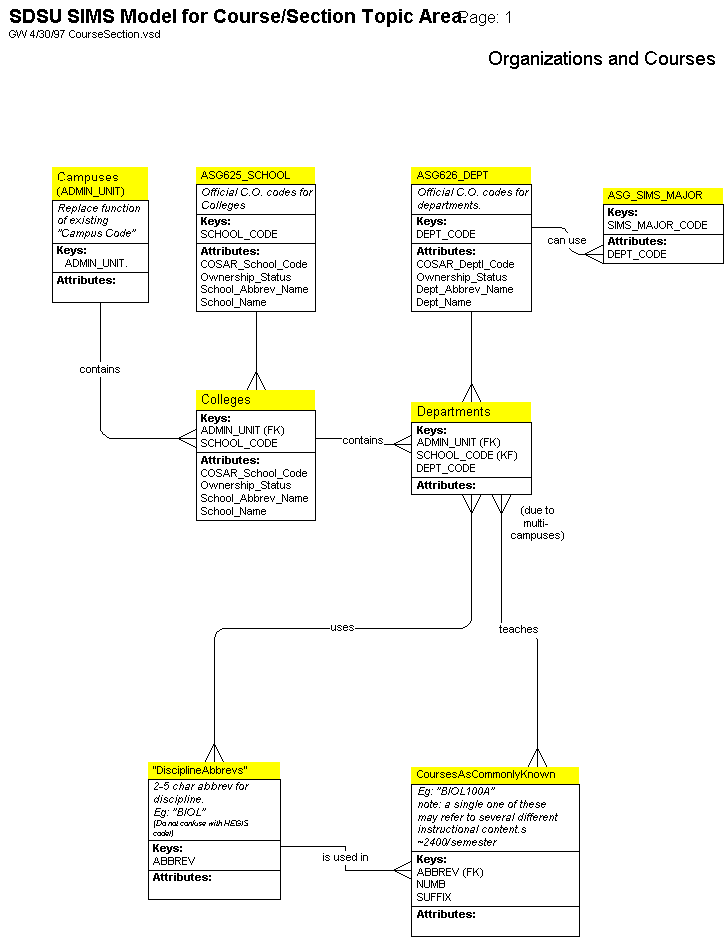
Conceptual Diagrams Showing Course, Section and Scheduling Subtleties
Go to: ![]() [Back to Models]
[Back to Models]